 Go back
Data Analysis
ISEN CIR 3 - 2024
Role
Developer and Analyst
Duration and Result
3 Weeks | 16/20
Team
3 people
Links
Github Repository
Live site (Soon)
Overview
This project aimed to optimize the management of green spaces in the city of Saint-Quentin (02) through the integration of solutions in Big Data, Artificial Intelligence (AI) and Web Development. Initially, comprehensive data collection and analysis of geospatial data related to urban trees enabled the creation of maps illustrating their distribution by neighborhood. These visualizations provide a clear perspective on areas requiring special attention in terms of management and maintenance.
Subsequently, predictive models were developed, including regression studies to estimate the age of the trees and logistic regression to identify those likely to be uprooted in the event of storms. The results highlighted significant correlations between various variables such as age, location, and tree type.
Finally, a web application was developed to centralize and facilitate access to the analysis results. This interface allows users to visualize data on interactive maps, add new trees to the database, and make predictions about their condition. By combining these technologies, this project aims to enhance decision-making and urban planning, contributing to a more effective and sustainable management of green spaces in Saint-Quentin.
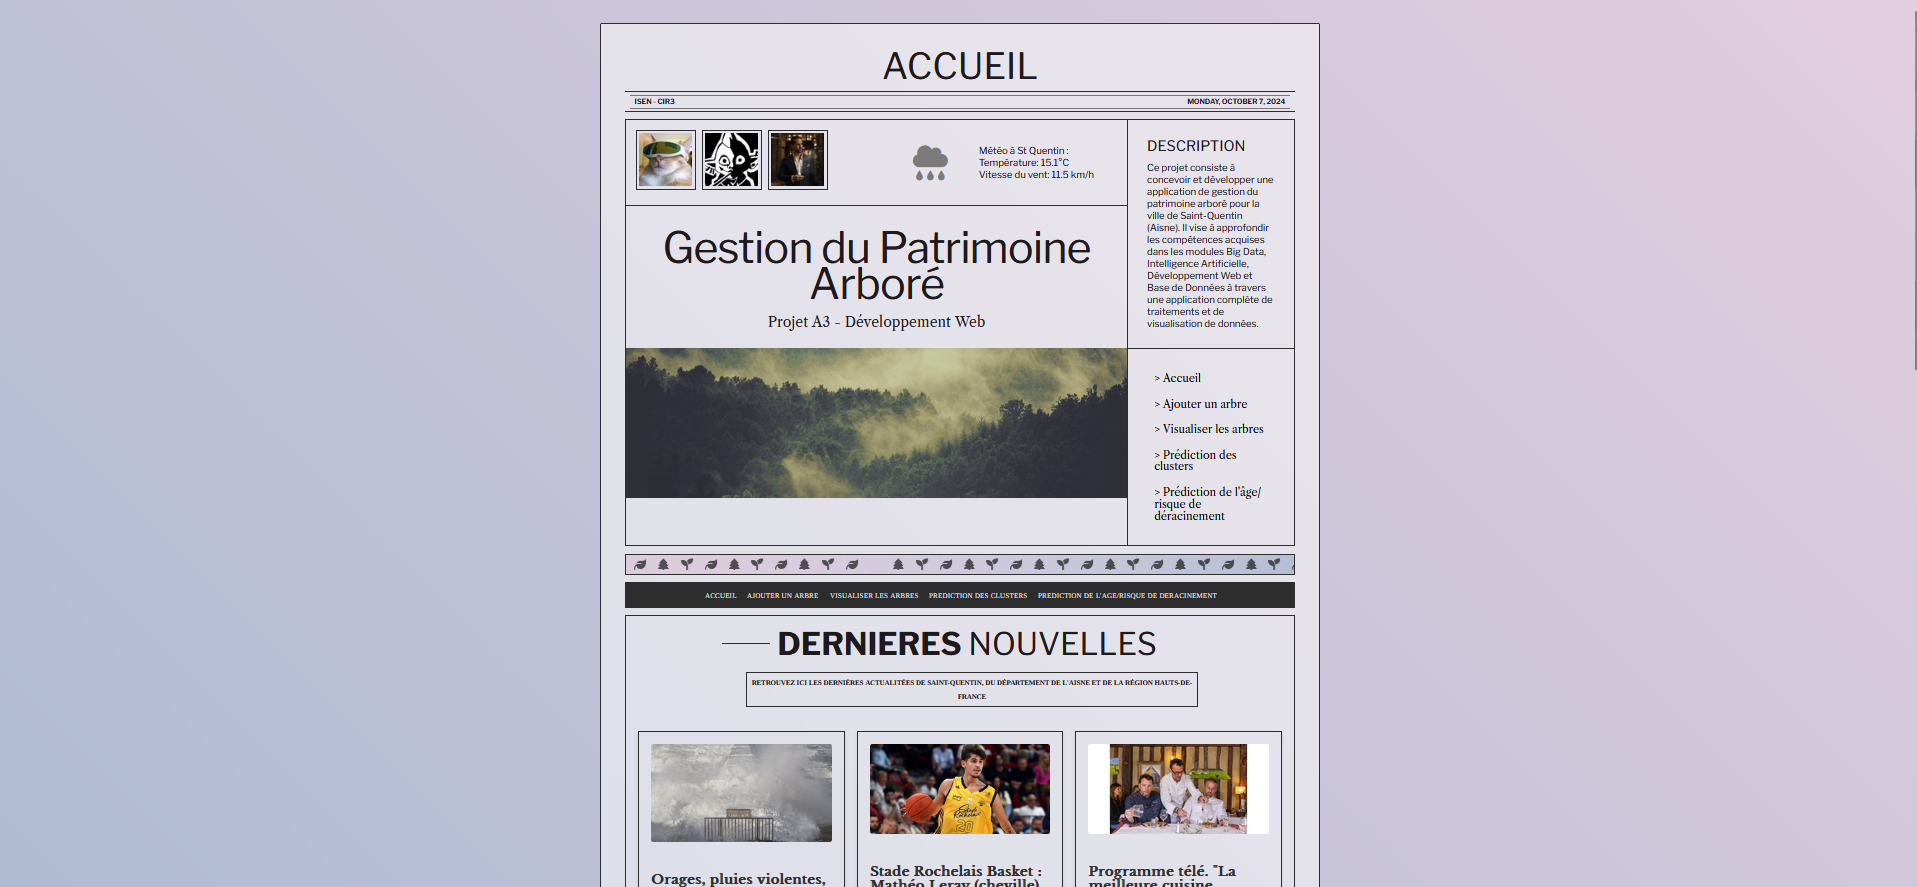
0.1
Home
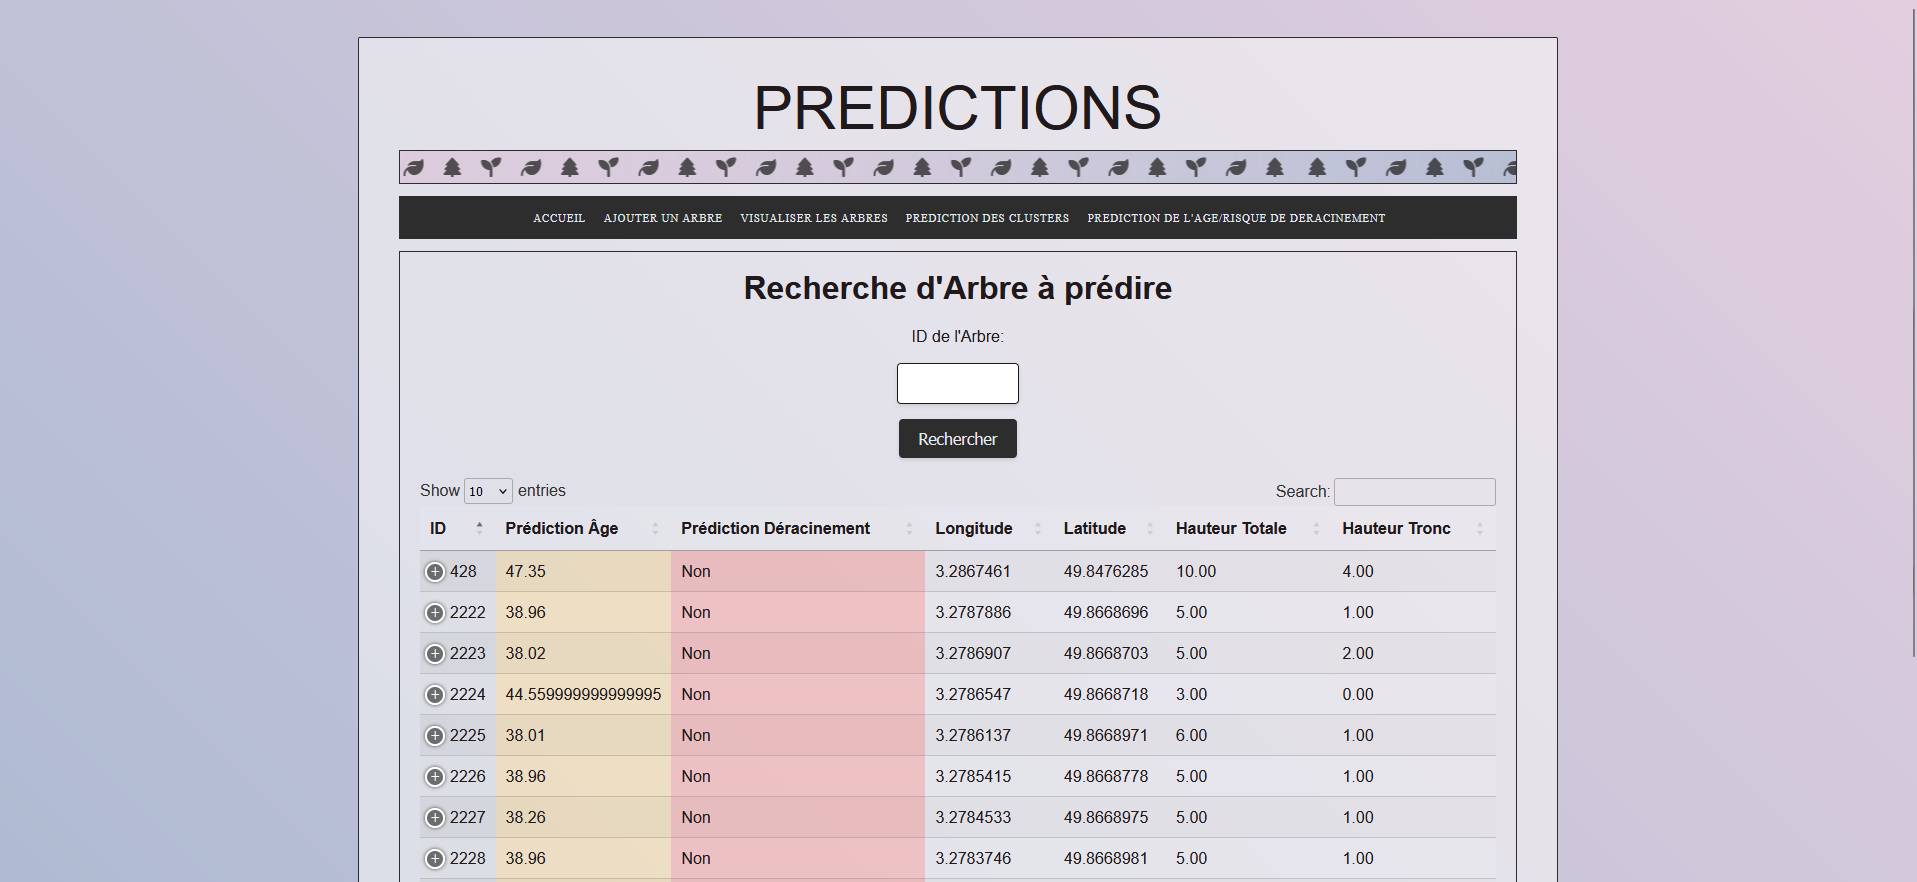
0.2
Predictions
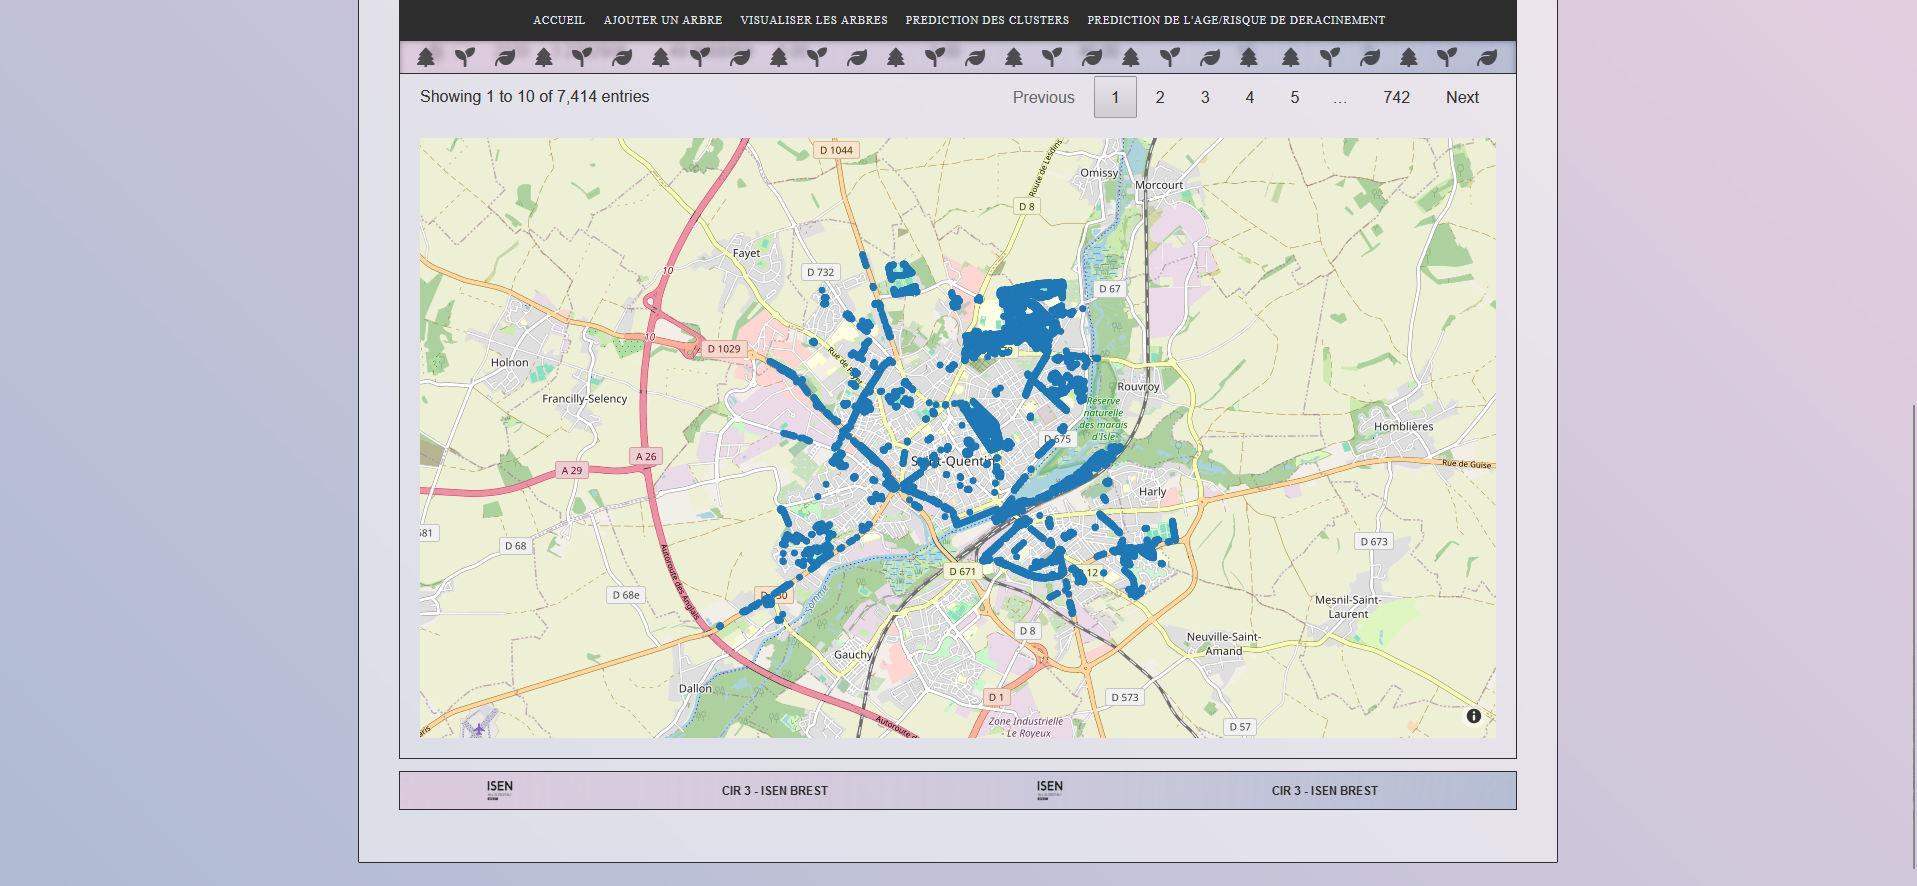
0.3
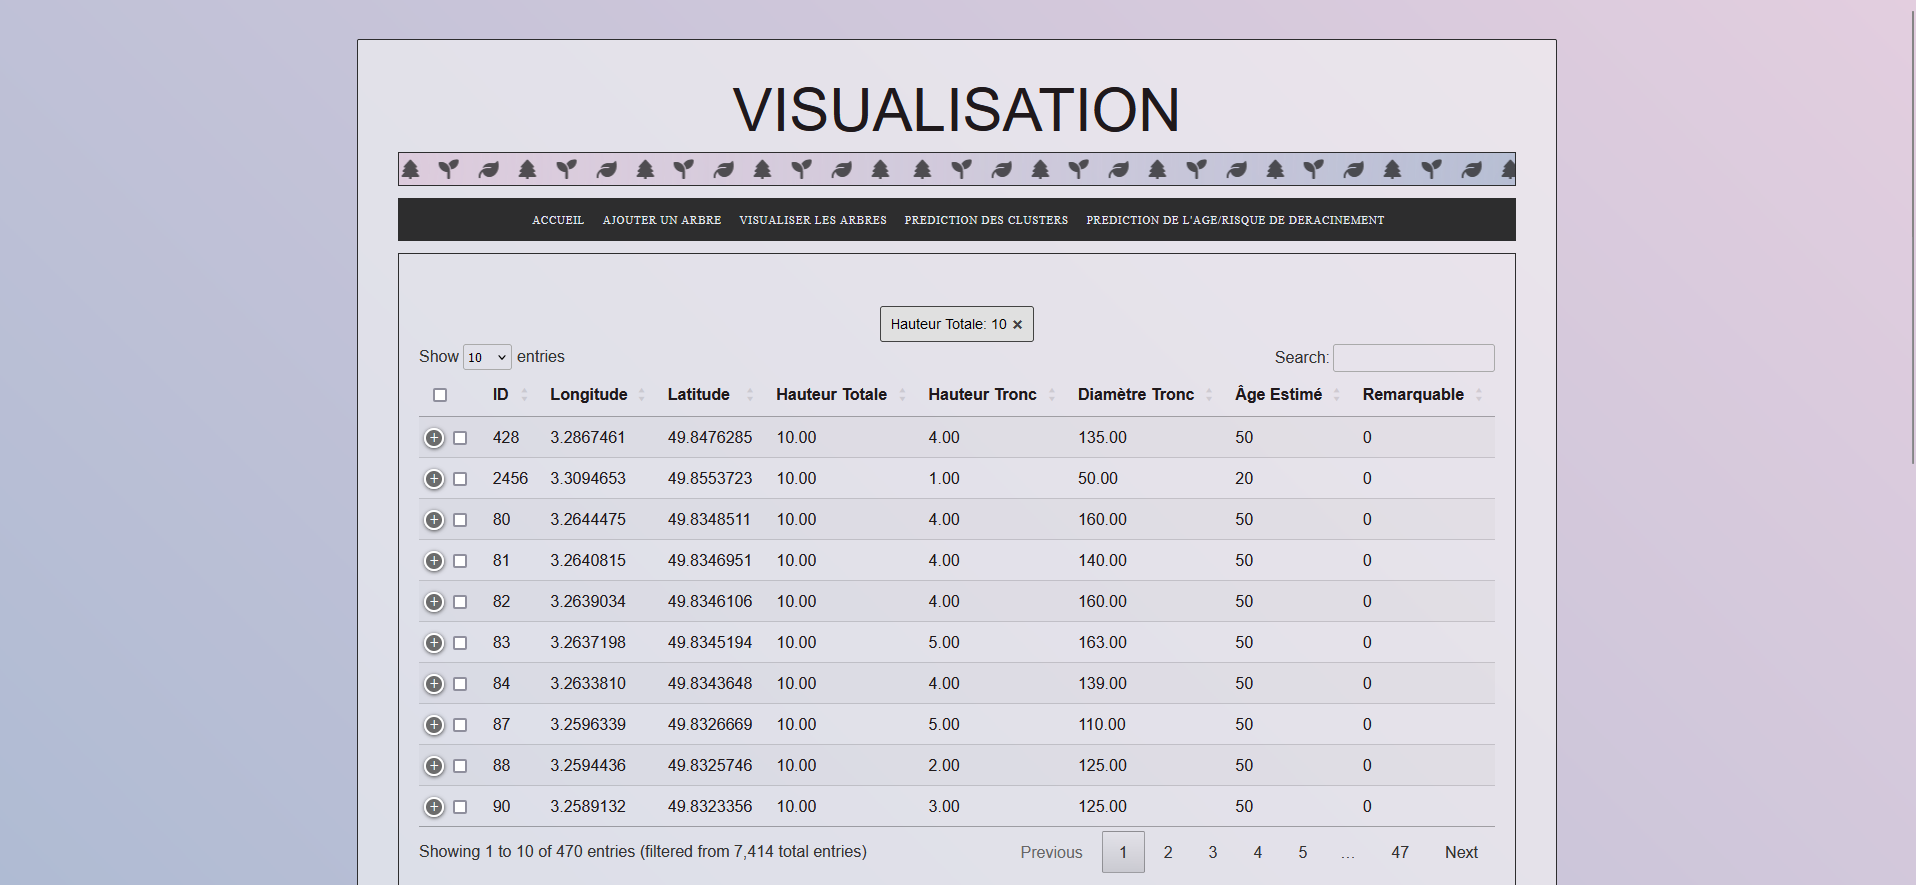
Visualization
Goal
Create a comprehensive technological solution for urban tree management.
The primary objective was to develop a platform combining Big Data and AI to analyze and visualize urban tree data while providing predictions on their health status. This included data analysis, the creation of predictive models, and the development of an intuitive web application.
Context
A practical academic project in Year 3 at ISEN.
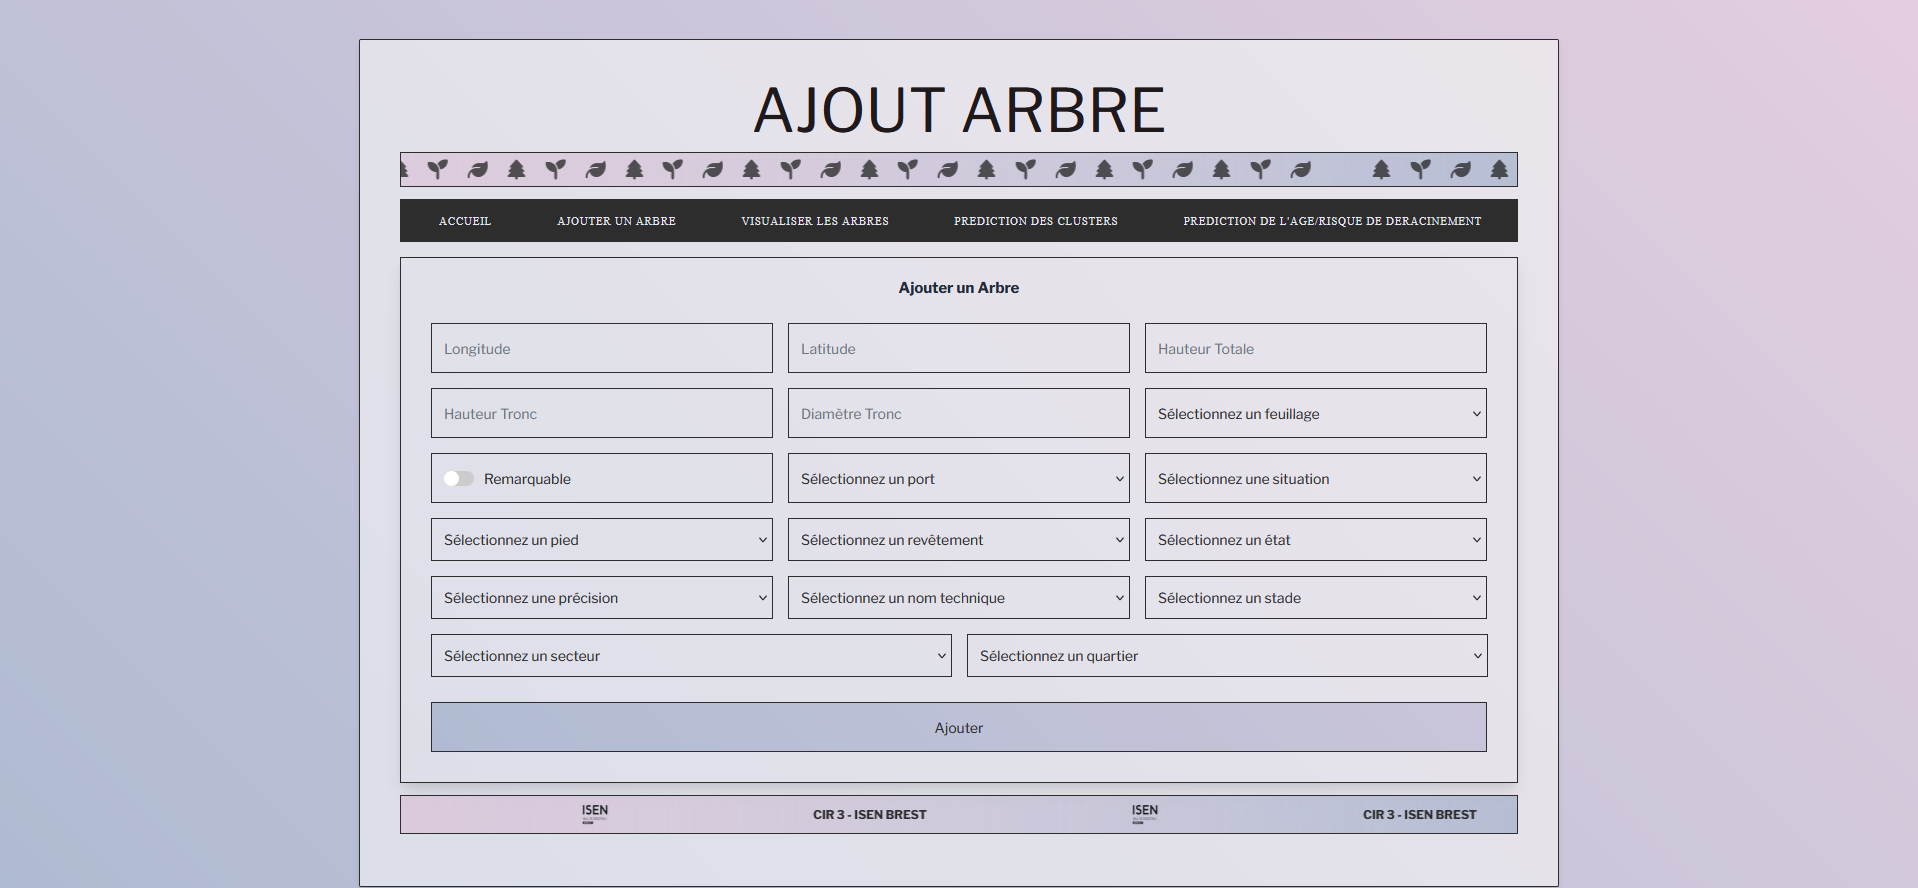
1.0
Add Decision Tree
Conducted as part of the Big Data/AI/Web curriculum at ISEN in 2024, this three-week project aimed to apply the theoretical skills acquired in a real-world context. The three-person team focused on urban tree management in Saint-Quentin, collaborating on data processing, AI modeling, and web development.
Process and Methodology
From data exploration to web interface implementation.
The project was carried out in several methodical stages:
Data exploration: cleaning and preparing the geospatial data of trees.
Predictive modeling: creating models to estimate tree ages (linear regression) and predict trees at risk in case of storms (logistic regression).
Web development: designing an interactive interface for visualizing and managing tree data on geospatial maps.
Testing and optimization: verifying the fluidity of predictions and user experience on the application.
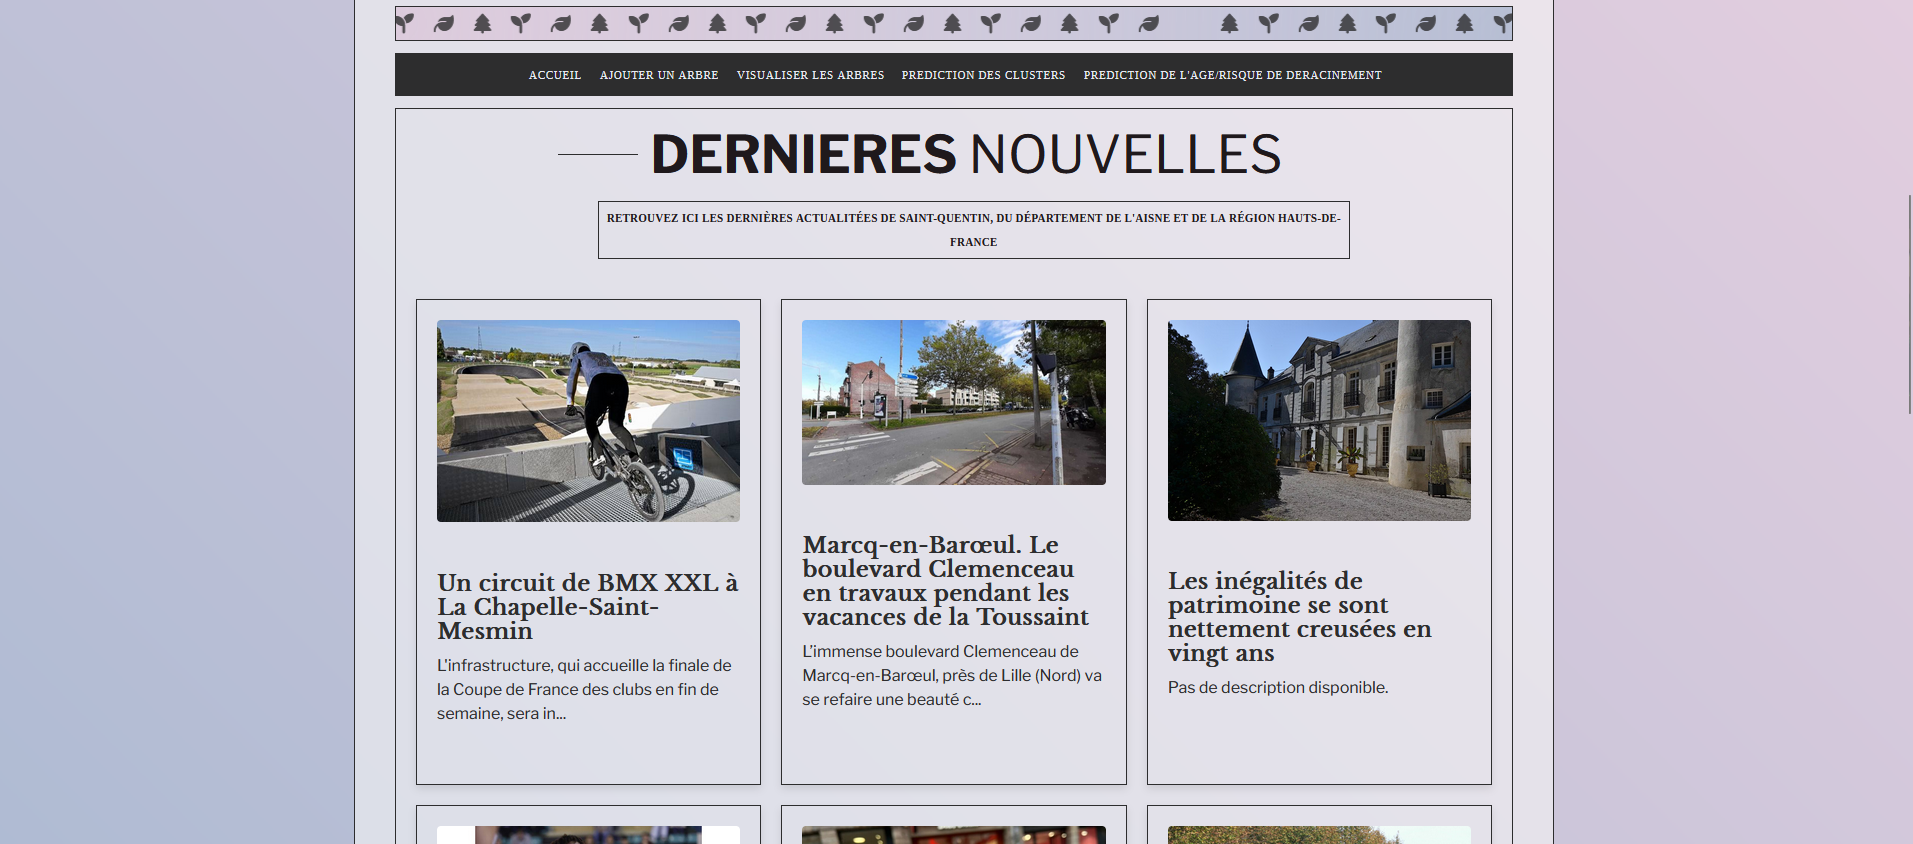
2.0
Saint-Quentin News Section
Challenges Faced and Solutions
Solving data and visualization challenges.
Data cleaning: Many data entries were incomplete or erroneous. We established correction processes to ensure data quality.
Complex modeling: Optimizing predictive models required constant adjustments to ensure their accuracy.
Interactive visualization: Representing tree data on a geospatial map was a challenge addressed through the use of Plotly.
Results
A functional and seamless application for urban management.
3.0
Visualization Dashboard
The project resulted in a comprehensive tool (scored 15/20 in Big Data, 16.51/20 in AI, and 16.73/20 in Web) that offers:
Clear and intuitive cartographic visualizations.
High-performing predictive models for estimating tree age and predicting at-risk trees.
A web application enabling real-time management of the tree population, with options for adding new trees and making predictions.
Lessons Learned and Skills Gained
Mastering data technologies and web development.
This project allowed for the acquisition of advanced skills in:
Processing and analyzing large datasets using Python, particularly with Pandas and Scikit-learn.
Predictive modeling using regression techniques for real-world cases.
Full-stack web development utilizing modern technologies to create a seamless user interface.
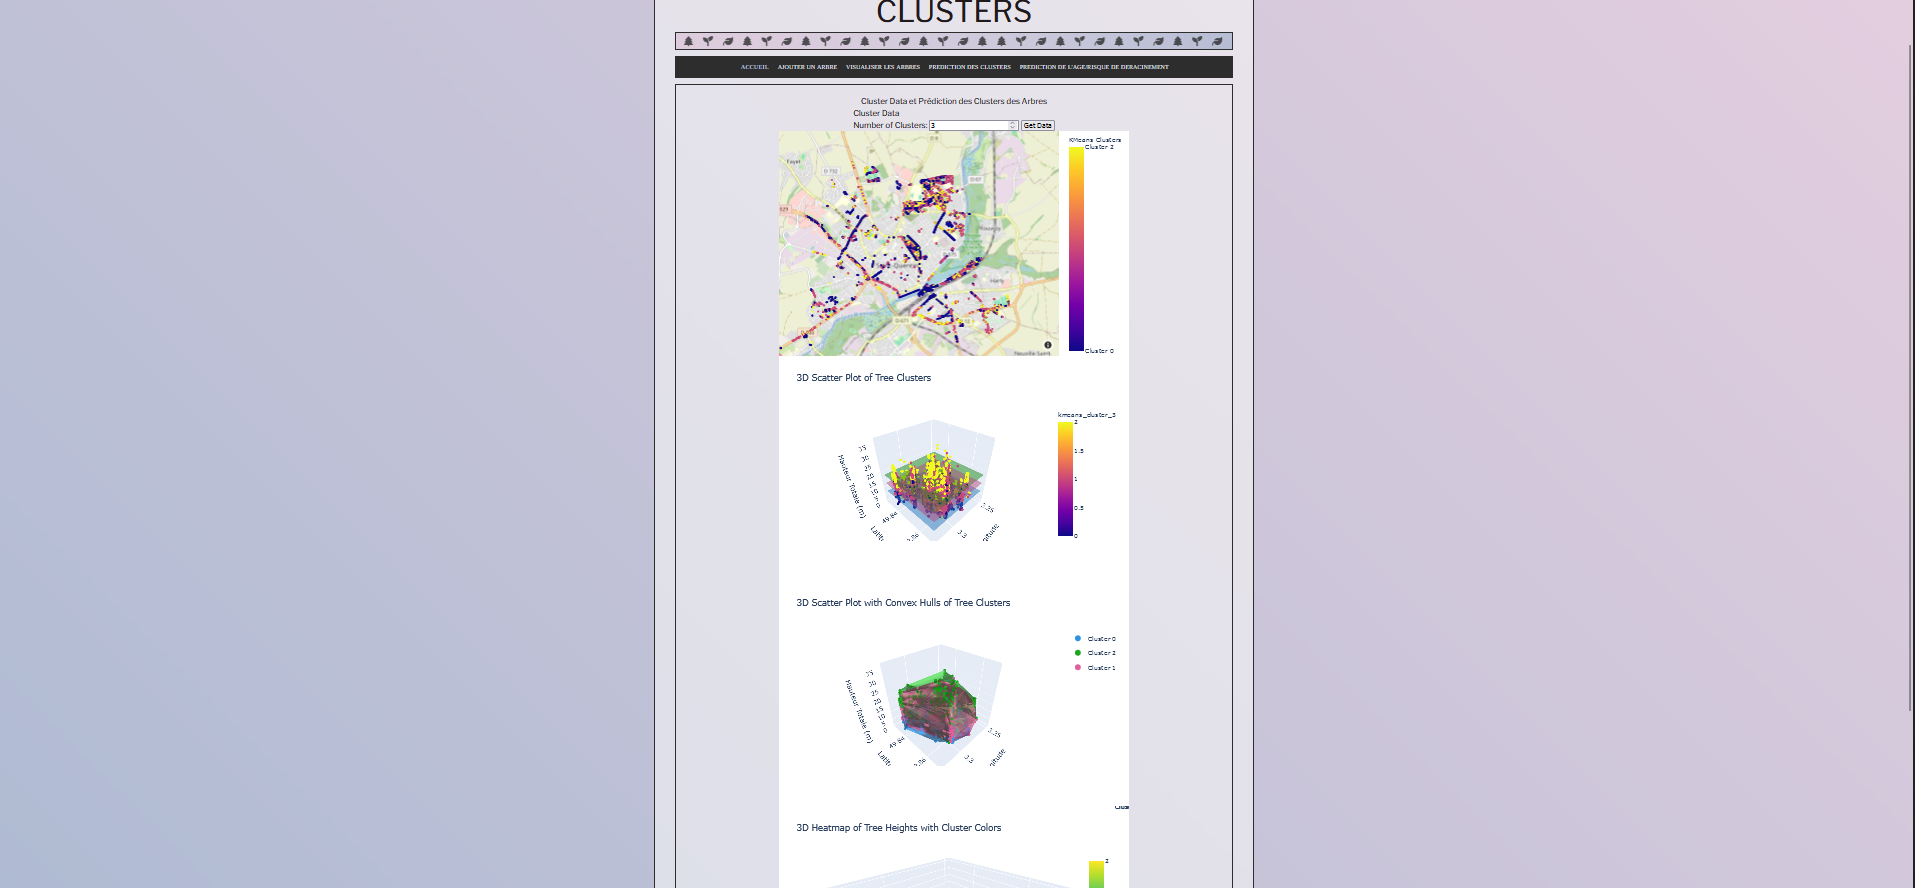
4.0
Cluster Visualization